Data Extraction
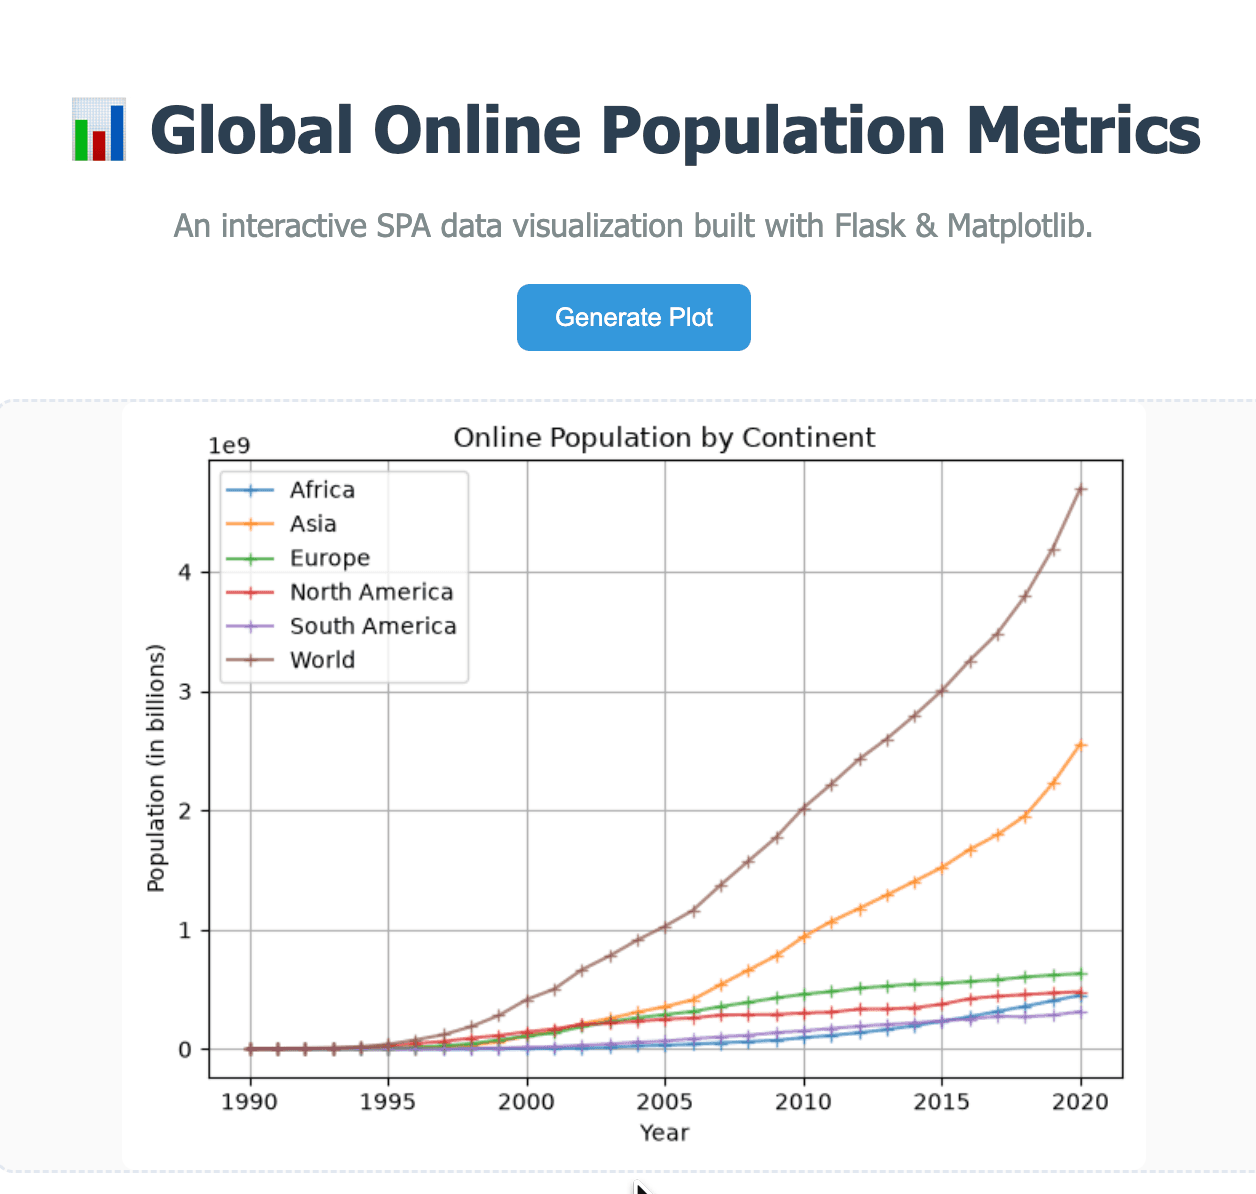
This project is a practical application of data processing and visualization for the web. It uses a Python backend to handle data from a provided CSV file and serves a clean Single Page Application (SPA) interface. The application processes the time-series data and utilizes the Matplotlib library to create clear, visually compelling charts. By clicking the "Generate Plot" button, users receive a tailored visual representation of the growth in online populations by continent, showcasing the integration of powerful data analysis tools into a user-friendly web experience.
Key Features: Server - side CSV data processing, dynamic chart generation, clean and minimalist Single Page Application interface.